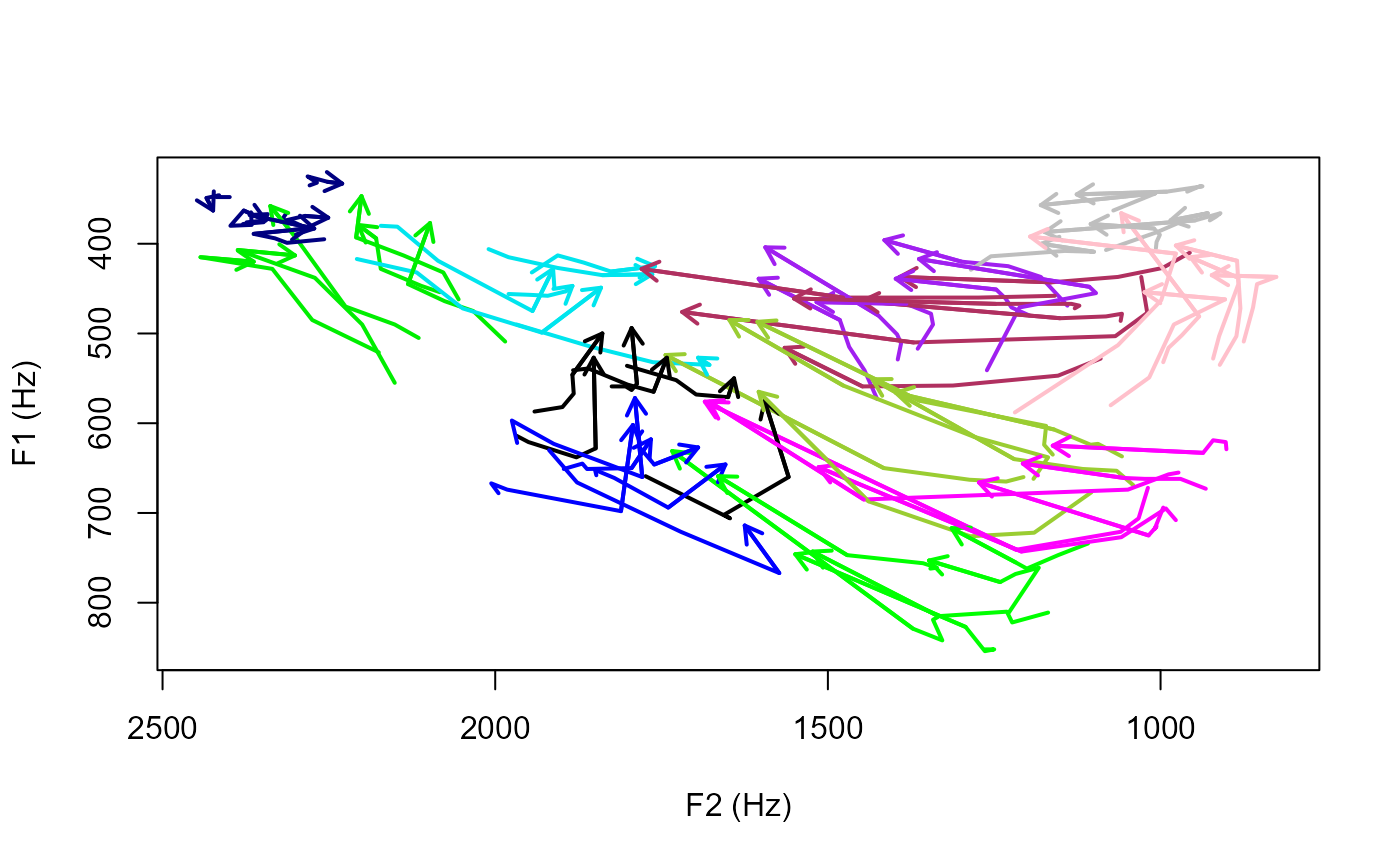
Add arrows to the end of contours made by the ft.contour function. Colors are taken from the 'color' column in the data.
ft.arrows(
  aggregated_data,
  xformant = 1,
  yformant = 2,
  revaxes = FALSE,
  logaxes = FALSE,
  lwd = 2,
  length = 0.1,
  add = TRUE,
  ...
)
Arguments
| aggregated_data | A dataframe containing the data from an 'aggregated_data' file produced by Fast Track. |
|---|---|
| xformant | an integer indicating which formant number should be plotted on the x axis. |
| yformant | an integer indicating which formant number should be plotted on the y axis. |
| revaxes | if TRUE, axis ranges are inverted so that they go high > low. |
| logaxes | if TRUE, axes are logarithmic. |
| lwd | an integer determining arrow line width. |
| length | the length of the arrow lines. |
| add | if FALSE, a new plot if created. |
| ... | Additional arguments are passed to the internal call of 'arrows'. |
Examples
ft.arrows (aggregated_data, xformant=2,yformant=1,revaxes=TRUE)